-
KittenTTS: Tiny Open-Source Text-to-Speech That Runs on CPU
KittenTTS is an open-source text-to-speech (TTS) project from KittenML that’s optimized for lightweight deployment and CPU inference. It’s currently in developer preview, but it’s exactly the kind of “small model”…
-
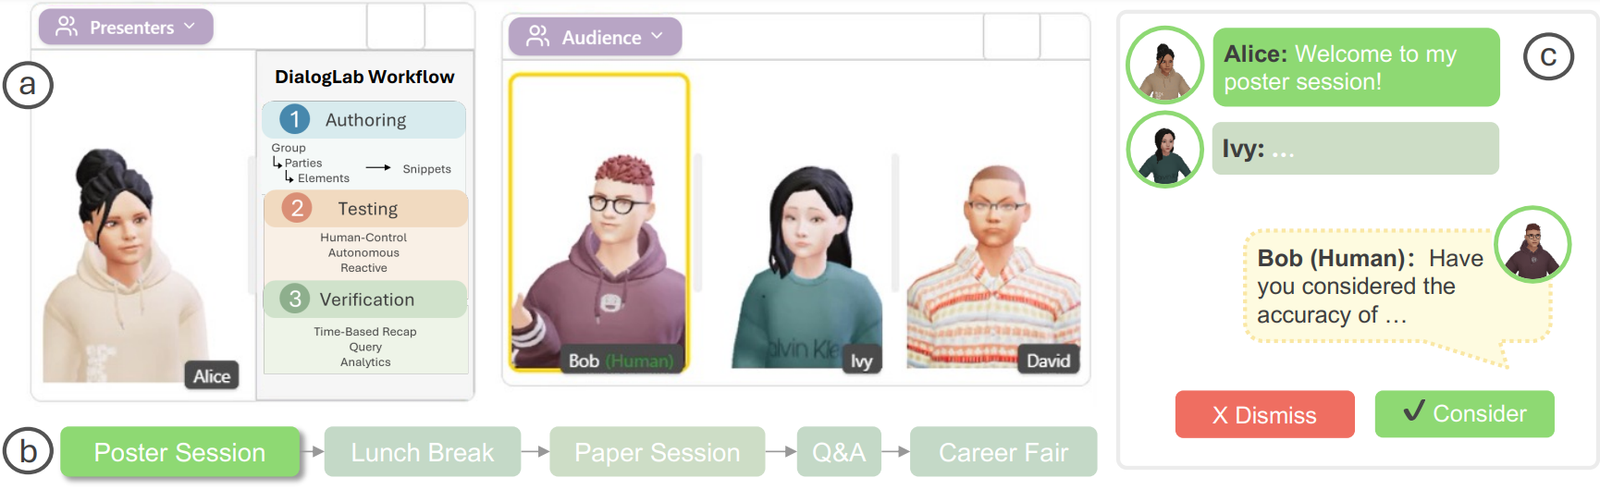
DialogLab: Simulating and Testing Dynamic Human‑AI Group Conversations (Google Research + UIST 2025)
DialogLab is an open-source prototyping framework from Google Research (UIST 2025) for something most LLM demos still avoid: dynamic, multi-party human–AI group conversations. Think team meetings, classrooms, panel discussions, social…
-
OpenAI’s In-house Data Agent (and the Open-Source Alternative) | Dash by Agno
Dash data agent is an open-source self-learning data agent inspired by OpenAI’s in-house data agent. The goal is ambitious but very practical: let teams ask questions in plain English and…
-

Enterprise-Level Free Automation Testing Using AI | Maestro
Maestro automation testing is an open-source framework that makes UI and end-to-end testing for Android, iOS, and even web apps simple and fast. Instead of writing brittle code-heavy tests, you…
-

Best Real-time Interactive AI Avatar Solution for Mobile Devices | Duix Mobile
Duix Mobile AI avatar is an open-source SDK for building a real-time interactive AI avatar experience on mobile devices (iOS/Android) and other edge screens. The promise is a character-like interface…
-
Stack for Real-Time Video, Audio, and Data | LiveKit
LiveKit real-time video is a developer-friendly stack for building real-time video, audio, and data experiences using WebRTC. If you’re building AI agents that can join calls, live copilots, voice assistants,…
-
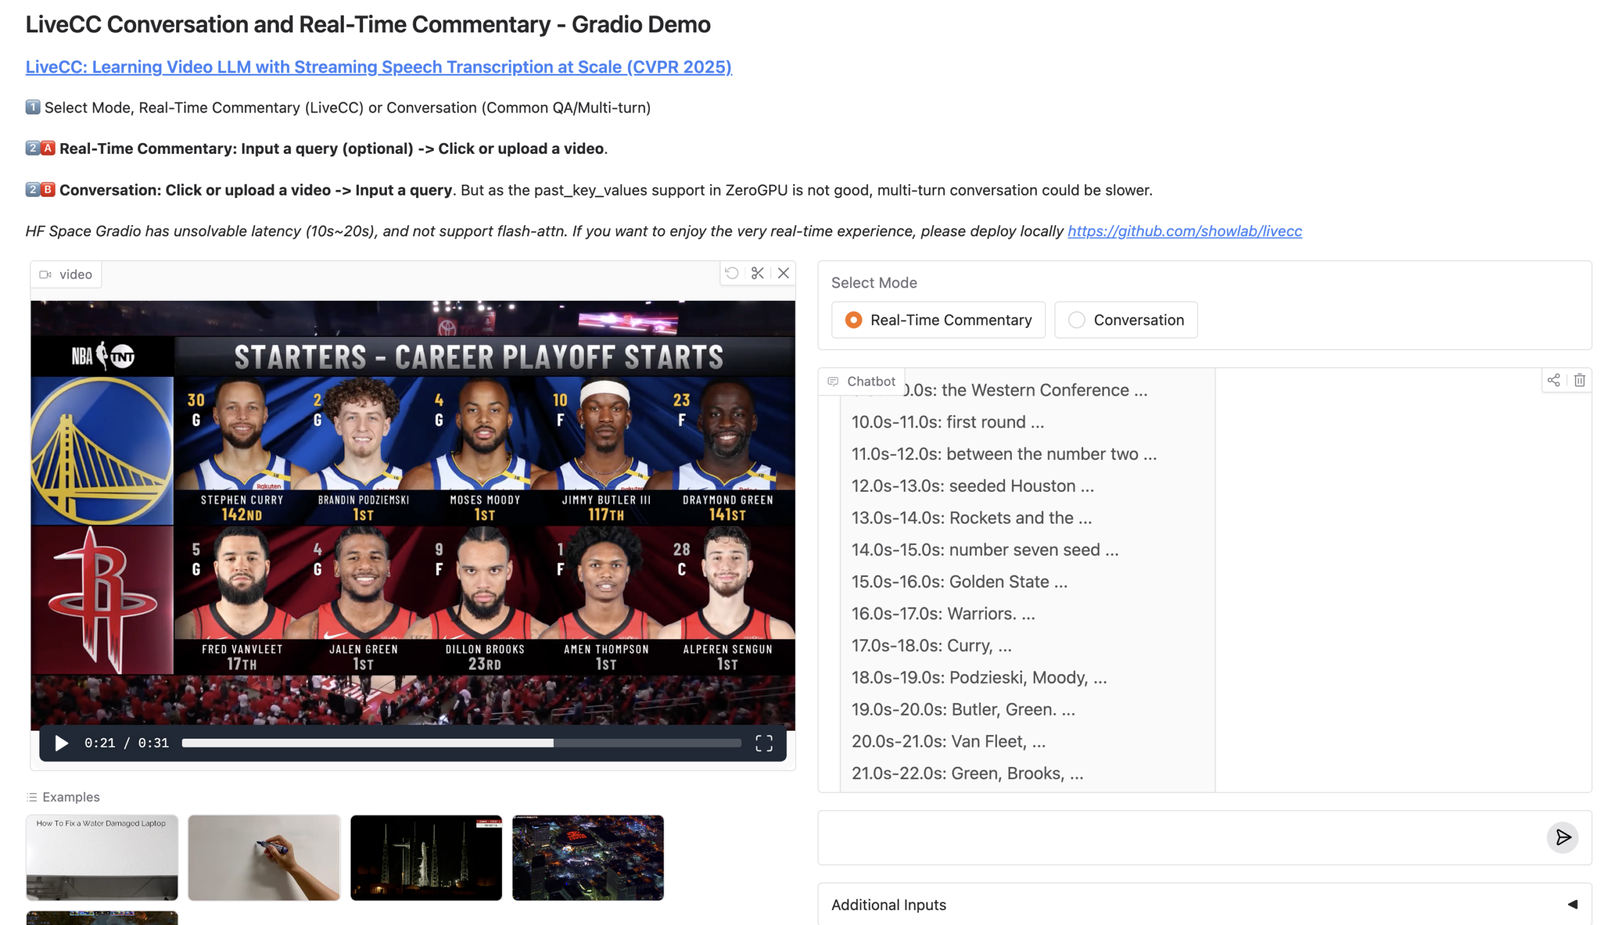
Video LLM for Real-Time Commentary with Streaming Speech Transcription | LiveCC
LiveCC video LLM is an open-source project that trains a video LLM to generate real-time commentary while the video is still playing, by pairing video understanding with streaming speech transcription.…