-

KV Caching in LLMs Explained: Faster Inference, Lower Cost, and How It Actually Works
KV caching in LLMs is one of the most important (and most misunderstood) reasons chatbots can stream tokens quickly. If you’ve ever wondered why the first response takes longer than…
-
OpenAI’s In-house Data Agent (and the Open-Source Alternative) | Dash by Agno
Dash data agent is an open-source self-learning data agent inspired by OpenAI’s in-house data agent. The goal is ambitious but very practical: let teams ask questions in plain English and…
-

Enterprise-Level Free Automation Testing Using AI | Maestro
Maestro automation testing is an open-source framework that makes UI and end-to-end testing for Android, iOS, and even web apps simple and fast. Instead of writing brittle code-heavy tests, you…
-

Best Real-time Interactive AI Avatar Solution for Mobile Devices | Duix Mobile
Duix Mobile AI avatar is an open-source SDK for building a real-time interactive AI avatar experience on mobile devices (iOS/Android) and other edge screens. The promise is a character-like interface…
-
Stack for Real-Time Video, Audio, and Data | LiveKit
LiveKit real-time video is a developer-friendly stack for building real-time video, audio, and data experiences using WebRTC. If you’re building AI agents that can join calls, live copilots, voice assistants,…
-
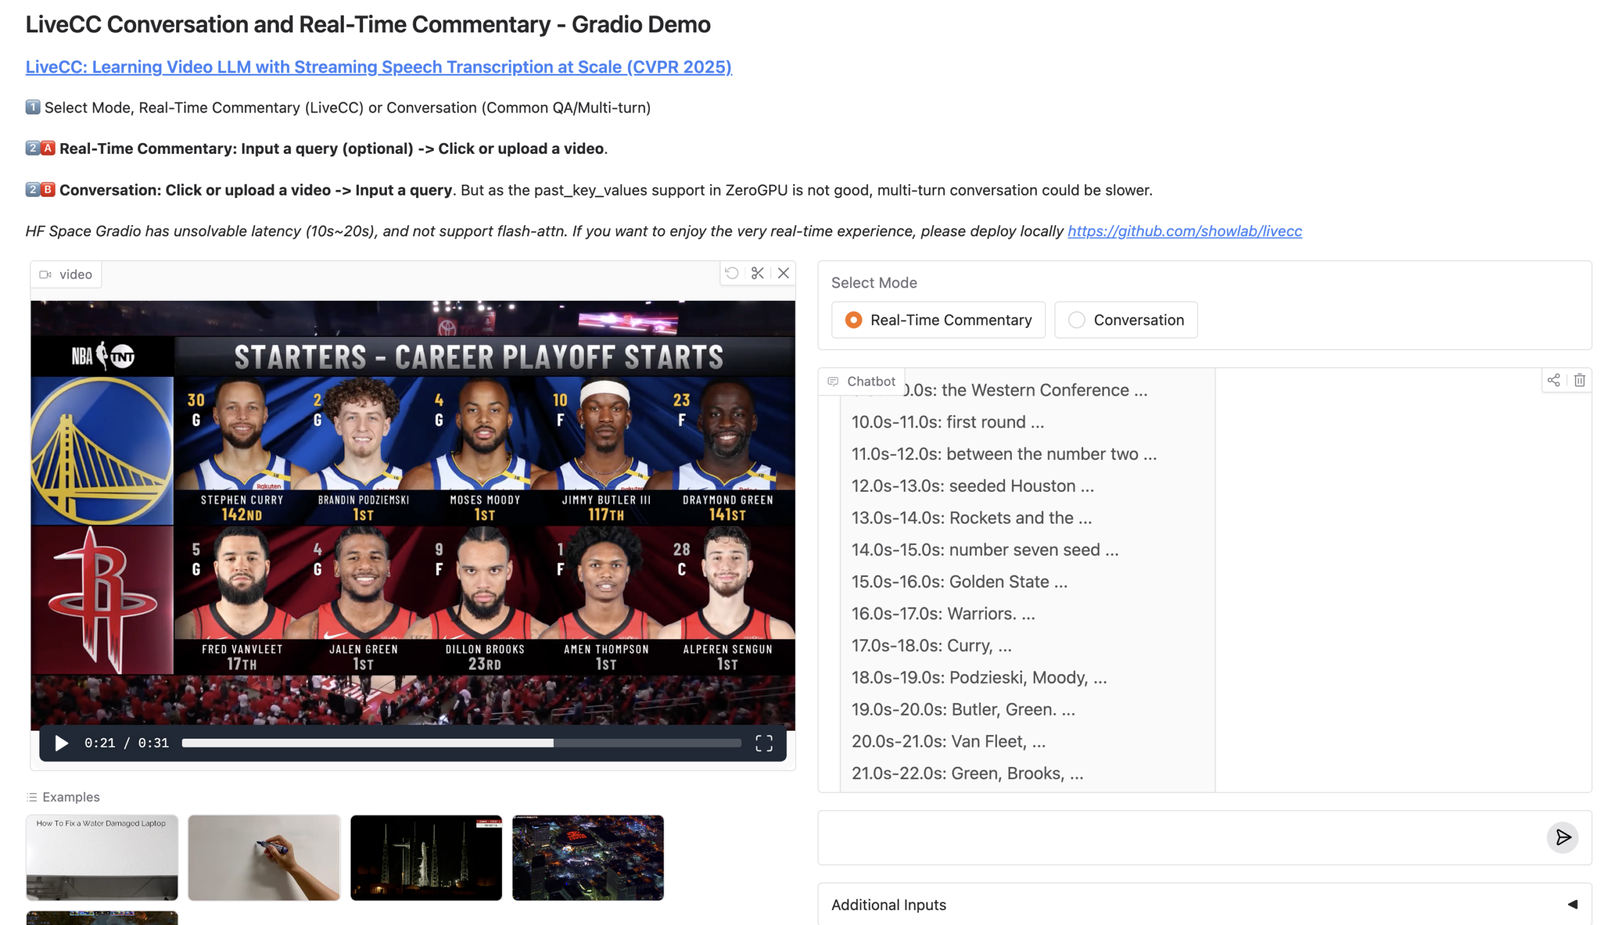
Video LLM for Real-Time Commentary with Streaming Speech Transcription | LiveCC
LiveCC video LLM is an open-source project that trains a video LLM to generate real-time commentary while the video is still playing, by pairing video understanding with streaming speech transcription.…
-

Routing Traces, Metrics, and Logs for LLM Agents (Pipelines + Exporters) | OpenTelemetry Collector
OpenTelemetry Collector for LLM agents: The OpenTelemetry Collector is the most underrated piece of an LLM agent observability stack. Instrumenting your agent runtime is step 1. Step 2 (the step…
-
Lightweight Distributed Tracing for Agent Workflows (Quick Setup + Visibility) | Zipkin
Zipkin for LLM agents: Zipkin is the “get tracing working today” option. It’s lightweight, approachable, and perfect when you want quick visibility into service latency and failures without adopting a…
-

Storing High-Volume Agent Traces Cost-Efficiently (OTel/Jaeger/Zipkin Ingest) | Grafana Tempo
Grafana Tempo for LLM agents: Grafana Tempo is built for one job: store a huge amount of tracing data cheaply, with minimal operational complexity. That matters for LLM agents because…
-

Debugging LLM Agent Tool Calls with Distributed Traces (Run IDs, Spans, Failures) | Jaeger
Jaeger for LLM agents: Jaeger is one of the easiest ways to see what your LLM agent actually did in production. When an agent fails, the final answer rarely tells…